You have drawn support and resistance zones. You know the trend. But where exactly does the pullback end and the trend resume? That is the million-dollar question Fibonacci retracement answers — and once you see it work on a live chart, you will wonder how you traded without it.
What Is Fibonacci Retracement?
Fibonacci retracement is a technical analysis tool that identifies potential reversal levels during a pullback. Based on the Fibonacci sequence, the key retracement levels are 23.6%, 38.2%, 61.8%, and 78.6%. In binary options trading, the 61.8% and 38.2% levels act like support and resistance within a trend — price often bounces from these levels and continues in the original direction.
The 61.8% level is the most important. Professional traders call it the “golden ratio” for a reason — it is the level where pullbacks reverse more often than any other. The 38.2% level works in strong trends, and the 78.6% level signals a potential trend change.
When this doesn’t work: Fibonacci levels fail in ranging markets and during high-impact news events. They work best when the trend is clearly established and the pullback is part of a natural market rhythm — not a reaction to a sudden fundamental shock.
When to Use Fibonacci Retracement
This strategy works best in specific conditions. Here is when to use it and when to stay out:
| Condition | Works | Avoid |
|---|---|---|
| Strong uptrend or downtrend | ✅ Clear levels for entries | ❌ Sideways chop gives false bounces |
| Moderate volatility | ✅ Price respects levels well | ❌ News spikes blow through levels |
| Higher timeframes (15m+) | ✅ More reliable reactions | ❌ 1-min charts produce noise |
| After a clear swing high/low | ✅ Clean Fibonacci placement | ❌ Ambiguous swings give ambiguous levels |
The London session (8 AM – 12 PM GMT) produces the cleanest Fibonacci setups. The first 30 minutes after a major news release is the worst time — let the market settle before drawing your levels.
Step-by-Step Trading Rules
Step 1: Identify a Clear Trend
Rule: Look for a series of higher highs and higher lows (uptrend) or lower highs and lower lows (downtrend) on the 15-minute chart.
Setup: 15-minute chart, any major pair (EUR/USD, GBP/USD) or crypto (BTC/USD).
Action: If price is making clear higher highs, you are only looking for CALL entries at Fibonacci support. If making lower highs, only PUT entries at Fibonacci resistance.
Do not draw Fibonacci levels yet. Confirm the trend first — everything else depends on this step.
Step 2: Draw Fibonacci Levels from Swing Low to Swing High
Rule: In an uptrend, draw Fibonacci from the most recent swing low to the most recent swing high. In a downtrend, draw from swing high to swing low.
Setup: Use your platform’s Fibonacci drawing tool. Most platforms (Pocket Option, IQ Option, Olymp Trade) have it built into the chart toolbar.
Key levels to watch: 38.2%, 50%, 61.8%, and 78.6%. The 50% level is not a true Fibonacci ratio but acts as a psychological zone where traders watch for reversals.
Action: Once drawn, these levels become your support zones (in an uptrend). Price will often retrace to one of these levels and then continue higher.
Step 3: Wait for Price to Retrace to a Key Level
Rule: Let price pull back to the 38.2%, 50%, or 61.8% level. Do not enter on the first touch — wait for the candle to close near the level.
Setup: 15-minute chart (or 5-minute for faster trades). Watch how price behaves as it approaches the level. A slow drift into 61.8% is more reliable than a fast spike into it.
Action: Mark the level on your chart. Prepare to enter but do not pull the trigger yet. You are waiting for confirmation in Step 4.
Step 4: Confirm with a Reversal Candle
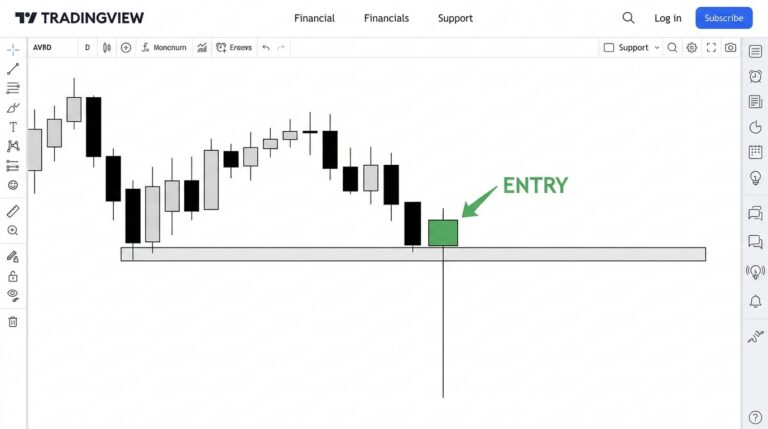
Rule: Look for a bullish reversal candle (hammer, bullish engulfing, or pin bar) at the Fibonacci level. This is your confirmation that the level is holding.
Setup: Same chart as Step 3. The confirmation candle must close at or above the Fibonacci level (for an uptrend). A long lower wick at the 61.8% level is a strong signal — it shows sellers tried to push price down but buyers stepped in.
Action: Once the reversal candle closes at the Fibonacci level, you have your entry signal.
Step 5: Enter the Trade with Defined Expiry
Rule: Enter a CALL option immediately after the reversal candle closes at the Fibonacci level. Place a PUT option if the same pattern appears at Fibonacci resistance in a downtrend.
Expiry: Set expiry to 30 minutes for 15-minute chart setups, or 15 minutes for 5-minute chart setups. The trend should continue for at least 2-3 candles after the bounce.
Risk per trade: 2-3% of account. Never more.
Real Trade Example
Setup: EUR/USD, 15-minute chart, uptrend confirmed with higher highs.
Fibonacci levels drawn: From swing low (1.0850) to swing high (1.0920) — 70-pip range. Key levels: 38.2% at 1.0893, 61.8% at 1.0877.
Signal: Price retraced to 1.0877 (61.8%). A bullish pin bar formed with a 15-pip lower wick. The candle closed at 1.0880 — above the 61.8% level.
Entry: CALL at 1.0880, 30-minute expiry, $20 trade size.
Outcome: Price bounced to 1.0915 within 22 minutes. Trade closed ITM — 86% payout ($17.20 profit).
Risk Management
Fibonacci retracement trading has clear risk rules that separate profitable traders from gamblers. Here is the framework:
| Parameter | Binary Options |
|---|---|
| Risk per trade | 2-3% of account |
| Max daily loss | 10-15% |
| Recommended expiry | 15-30 min (5-15 min chart) |
| Stop after | 3 consecutive losses |
| Minimum account | $100 |
A common mistake is moving your Fibonacci levels after price breaks them. If price breaks through the 61.8% level and heads toward 78.6%, do not redraw — accept that this trade setup has failed and move on. The next level is not a better entry; it is a warning that the trend may be weakening.
If price breaks the 78.6% level entirely, the trend is likely over. Stop trading this setup and look for a new trend on a higher timeframe.
Pros & Cons
| ✅ Pros | ❌ Cons |
|---|---|
| Clear, objective entry levels | Requires practice to draw correctly |
| Works across all timeframes | Fails in ranging markets |
| Compatible with any platform | Multiple levels can be confusing |
| Combines well with candlestick patterns | Spikes through levels during news |
| High win rate in strong trends | Subjective swing point selection |
Which Platforms Support This Strategy
Fibonacci retracement works on any platform with a Fibonacci drawing tool. Here is how the major platforms compare:
Pocket Option — Best for Low Budget
Built-in Fibonacci drawing tool in the chart toolbar. 15+ indicators for confirmation, 5-min and 15-min charts available. The $5 minimum deposit makes it the most accessible for testing this strategy with real money. Crypto withdrawals process in 1-4 hours. Start practicing Fibonacci on Pocket Option →
IQ Option — Best for Multi-Timeframe Analysis
Professional-grade Fibonacci tool with automatic level labels. 20+ indicators, TradingView-like charts, and multi-timeframe analysis — essential for confirming trends across 5-min and 15-min charts. Set up on IQ Option →
Olymp Trade — Best for Fixed-Time Trading
Fixed-time trading pairs naturally with Fibonacci — set your entry at the level and let the expiry handle the rest. Built-in drawing tools and RSI for additional confirmation. Try Olymp Trade →
TradingSkillLab may receive compensation when you sign up through links in this article. This does not affect our rankings or evaluations.
Common Mistakes
Here are the most common mistakes traders make with Fibonacci retracement — and how to avoid each one:
- Drawing levels from the wrong swing points — Always draw from significant swing highs and lows, not every minor zigzag. A wrong starting point gives useless levels.
- Entering on the first touch without confirmation — Price can spike through a Fibonacci level and close below it. Always wait for a reversal candle close before entering.
- Using too many Fibonacci levels — Stick to 38.2%, 50%, and 61.8%. Adding 23.6% and 78.6% to every chart creates noise, not signals.
- Trading Fibonacci in a sideways market — Fibonacci retracement works in trends. In ranging markets, levels fail constantly. Check the higher timeframe first.
- Redrawing levels after they break — If 61.8% breaks, do not shift to 78.6% and hope. Accept the failed setup and wait for a new opportunity.
FAQ
Is Fibonacci retracement better for binary options or forex?
It works well for both, but binary options traders benefit more because you do not need to manage a stop-loss. If price reaches your Fibonacci level and bounces, you profit at expiry. Forex traders need to set stop-losses below the level, which adds complexity.
What is the best timeframe for Fibonacci retracement?
The 15-minute chart offers the best balance of reliability and trade frequency. Five-minute charts produce more setups but with lower accuracy. One-hour charts are more reliable but you may wait days for a setup. Start with 15-minute and adjust as you gain experience.
Which Fibonacci level is most reliable?
The 61.8% level is the most reliable across all markets and timeframes. The 38.2% level works in very strong trends but offers a smaller potential move. The 78.6% level signals a potential trend change — treat it as a warning, not an entry signal.
Next Steps
Now that you understand Fibonacci retracement, here is what to learn next:
- Support and Resistance Strategy → — Fibonacci levels are dynamic support and resistance. Master the static version first.
- Pin Bar Strategy → — The pin bar is the ideal confirmation candle for Fibonacci bounces. Learn to trade it standalone.
- Pocket Option vs IQ Option → — See which platform has the best Fibonacci drawing tools.
Was this strategy helpful?